CBAs – Centre Bounce Attendances – is a statistic that measures the number of times a player is present at a centre bounce at the beginning of a quarter or following a goal. A player that has a high attendance rate at CBAs is around the footy more and (in some cases) in a more fantasy-friendly midfield role.
Analyse the CBAs from the football weekend in our user-friendly tables in our premium resources section – featuring advanced analytical tools to better measure the most significant changes, seasonally and week-to-week.
Zach Merrett
A centre-bounce attendance rate of just 37.5% is very low for a normally consistent midfielder in Zach Merrett. The problem comes down to the fact that the Bombers already had four players with heavy usage – and a Jake Stringer (80%) coming into that affected everyone.
Looking at Merrett’s disposal counts, we can see that he only had two disposals from the centre-bounce. He’s usually consistent in this measure and has a nice balance between the centre-bounce and around-the-ground.
| Round | Fantasy | CBAs | CBA% | Centre Bounce | Around Ground |
|---|---|---|---|---|---|
| 1 | 107 | 21 | 67.7 | 6 | 23 |
| 2 | 100 | 27 | 90 | 10 | 21 |
| 3 | 103 | 18 | 64.3 | 5 | 20 |
| 4 | 109 | 22 | 84.6 | 10 | 18 |
| 5 | 119 | 21 | 72.4 | 5 | 30 |
| 7 | 82 | 15 | 37.5 | 2 | 17 |
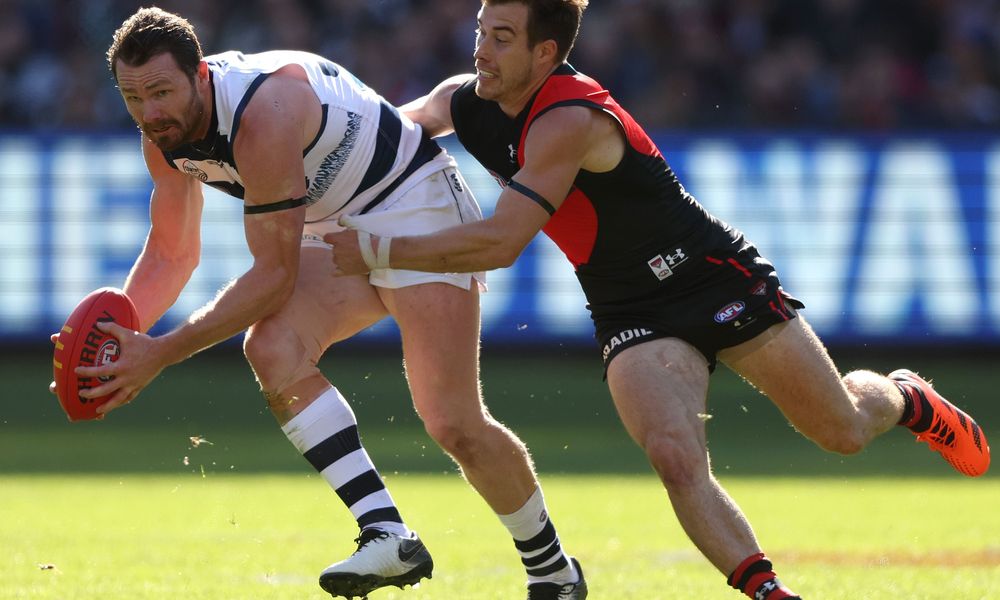
Patrick Dangerfield
He is back to his best form, and is in a consistent midfield role. Dangerfield leads the league for centre clearances, averaging 4 per game. Unsurprisingly, he is averaging 6.9 disposals per game purely from the centre-bounce, which is the 8th best in the league to this point. That’s 15-20 fantasy points per game purely from this source. 27.9% of his disposals this season are from centre-bounces making him the most CBA-reliant player in the competition.
Andrew Brayshaw
It’s been a somewhat underwhelming start to the season for Andrew Brayshaw’s fantasy prospects. He and Caleb Serong have lead the Fremantle midfield this year with over 75% CBAs each, but is only averaging 94.7 over his last three games.
Brayshaw is more reliant on getting disposals on the outside of the contest. Over the last two seasons, 16% of his disposals come from centre-bounces despite attending 19 CBAs per game. Compared to other elite fantasy midfielders, Brayshaw gets the ball less at centre-bounces. Not every player relies on them for fantasy points!
| Player | Centre-Bounce Disposals per CBA |
|---|---|
| Andrew Brayshaw | 0.21 |
| Jack Steele | 0.26 |
| Tim Taranto | 0.27 |
| Tom Green | 0.27 |
| Clayton Oliver | 0.30 |
| Rory Laird | 0.31 |
| Caleb Serong | 0.36 |
Toby Greene
An interesting one to watch for Fantasy scoring. The Giants don’t really have any proper midfield spots available, but he is averaging 101.3 over his last three matches. While his centre-bounce attendance numbers aren’t massive, it’s more about the impact he’s having in there. Over the last two weeks, Greene has had 14 disposals from centre-bounce chains, which is similar to an elite midfielder that gets more CBAs.
| Round | Fantasy | CBAs | CBA % | Centre Bounce | Around Ground |
|---|---|---|---|---|---|
| 6 | 98 | 11 | 33.3 | 8 | 14 |
| 7 | 96 | 7 | 19.4 | 6 | 16 |
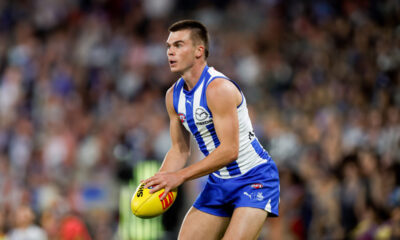
Jy Simpkin
After missing two games already this season (and another with 28% TOG), Simpkin was back in the centre-bounces in Round 7. He scored 102 fantasy points – a season high, alongside a massive 30 centre-bounce-attendances. His season average is going to be much higher than his current 83.8, so he could be a good one to try and trade for in your draft leagues! Simpkin was 3rd for total CBAs last season behind Lachie Neale and Jarrod Witts. 23% of his disposals last year came from CBAs which is higher than average.
Preview of Advanced CBA Stats:
| Player | Club | Pos | LG% | LG%vsPG% | Avg% | L3Avg% | LG%vsAvg% | L3G%vsAvg% |
|---|---|---|---|---|---|---|---|---|
| Jack Steele | SK | C | 81 | -5 | 88.4 | 87 | -7.4 | -1.4 |
| Reilly O’Brien | AD | R | 80 | -4 | 87.7 | 84 | -7.7 | -3.7 |
| Rowan Marshall | SK | R | 88 | +12 | 87.7 | 87 | +0.3 | -0.7 |
| Max Gawn | ME | R | 90 | -2 | 86.6 | 89 | +3.4 | +2.4 |
| Tom Green | GWS | C | 85 | +5 | 86 | 83 | -1 | -3 |
| Luke Davies-Uniacke | NM | C | 83 | +3 | 85.1 | 83 | -2.1 | -2.1 |
| Ned Reeves | HW | R | 82 | -5 | 84.5 | 79 | -2.5 | -5.5 |
| Lloyd Meek | HW | R | 77 | -13 | 84.4 | 82 | -7.4 | -2.4 |
| Jarrod Witts | GC | R | 82 | -11 | 84.2 | 86 | -2.2 | +1.8 |
| Tristan Xerri | NM | R | 83 | +3 | 83.4 | 82 | -0.4 | -1.4 |
View more CBA Analysis numbers here.
Key:
LG% – Percentage of CBAs last game
LG%vsPG% – Percentage of CBAs last game versus percentage of CBAs previous game
Avg% – Average of CBA percentage in games played
L3Avg% – Average of CBA percentage over the past three games
LG%vsAvg% – Last game CBA percentage vs average CBA percentage
L3G%vsAvg% – Last three games CBA percentage vs average CBA percentage