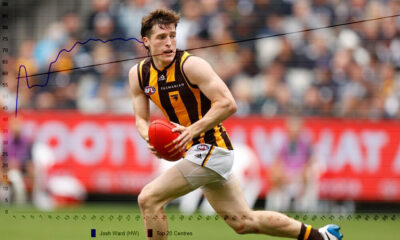
Chart:
Data:
Defenders
| Name | Club | Pos | Games | 100s | %100s | Car. Avg. | T10 | Diff |
|---|---|---|---|---|---|---|---|---|
| Harry Sheezel | NM | B | 32 | 18 | 56.3 | 102.4 | 74.6 | +27.8 |
| Nick Daicos | CW | B,C | 56 | 28 | 50 | 98.5 | 75.5 | +23 |
| Sam Clohesy | GC | B,C | 6 | 1 | 16.7 | 81 | 65.4 | +15.6 |
| Hayden Young | FR | B,C | 66 | 16 | 24.2 | 84.8 | 73.1 | +11.7 |
| Nic Martin | ES | B,C | 53 | 18 | 34 | 87.5 | 76.2 | +11.3 |
| Nasiah Wanganeen-Milera | SK | B | 49 | 14 | 28.6 | 83.1 | 76.4 | +6.7 |
| Colby McKercher | NM | B,C | 9 | 1 | 11.1 | 73.2 | 67.2 | +6 |
| Isaac Cumming | GWS | B,C | 75 | 13 | 17.3 | 76.3 | 71.1 | +5.2 |
| Will Graham | GC | B,C | 5 | 1 | 20 | 71.2 | 66 | +5.2 |
| Jordan Ridley | ES | B | 85 | 11 | 12.9 | 75.6 | 72.1 | +3.5 |
Midfielders
| Name | Club | Pos | Games | 100s | %100s | Car. Avg. | T20 | Diff |
|---|---|---|---|---|---|---|---|---|
| Nick Daicos | CW | B,C | 56 | 28 | 50 | 98.5 | 70.9 | +27.6 |
| Sam Clohesy | GC | B,C | 6 | 1 | 16.7 | 81 | 59.5 | +21.5 |
| Caleb Serong | FR | C | 89 | 39 | 43.8 | 91.8 | 72 | +19.8 |
| Errol Gulden | SY | C | 76 | 28 | 36.8 | 91.7 | 72.3 | +19.4 |
| Will Ashcroft | BL | C | 18 | 4 | 22.2 | 82.9 | 64.8 | +18.1 |
| Nic Martin | ES | B,C | 53 | 18 | 34 | 87.5 | 69.5 | +18 |
| Noah Anderson | GC | C | 90 | 29 | 32.2 | 88.1 | 72.3 | +15.8 |
| Tom Green | GWS | C | 76 | 30 | 39.5 | 87 | 72.3 | +14.7 |
| Jai Newcombe | HW | C | 59 | 16 | 27.1 | 85.8 | 71.3 | +14.5 |
| Will Graham | GC | B,C | 5 | 1 | 20 | 71.2 | 57.2 | +14 |
Rucks
| Name | Club | Pos | Games | 100s | %100s | Car. Avg. | T5 | Diff |
|---|---|---|---|---|---|---|---|---|
| Kieren Briggs | GWS | R | 35 | 8 | 22.9 | 80.3 | 65.2 | +15.1 |
| Toby Conway | GE | R | 3 | 0 | 0 | 64.3 | 56.6 | +7.7 |
| Ned Moyle | GC | R | 3 | 0 | 0 | 63 | 56.6 | +6.4 |
| Matt Flynn | WC | R | 33 | 4 | 12.1 | 70.5 | 64.9 | +5.6 |
| Braydon Preuss | GWS | R | 28 | 7 | 25 | 69.2 | 64 | +5.2 |
| Kieran Strachan | AD | R | 5 | 0 | 0 | 62.2 | 57.2 | +5 |
| Darcy Cameron | CW | R | 81 | 14 | 17.3 | 74.4 | 72.5 | +1.9 |
| Jordon Sweet | PA | R | 14 | 0 | 0 | 65.4 | 65.6 | -0.2 |
| Peter Ladhams | SY | R | 52 | 7 | 13.5 | 67.8 | 69.4 | -1.6 |
| Tristan Xerri | NM | R | 42 | 7 | 16.7 | 64.1 | 66.3 | -2.2 |
Forwards
| Name | Club | Pos | Games | 100s | %100s | Car. Avg. | T10 | Diff |
|---|---|---|---|---|---|---|---|---|
| Joe Richards | CW | F | 1 | 0 | 0 | 81 | 52.8 | +28.2 |
| Darcy Wilson | SK | C,F | 9 | 1 | 11.1 | 71.6 | 61.7 | +9.9 |
| Joel Freijah | WB | C,F | 1 | 0 | 0 | 62 | 52.8 | +9.2 |
| Dylan Moore | HW | F | 84 | 19 | 22.6 | 80.8 | 72.8 | +8 |
| Ryley Sanders | WB | C,F | 6 | 0 | 0 | 62.7 | 59.5 | +3.2 |
| Harley Reid | WC | C,F | 8 | 0 | 0 | 62.8 | 61.4 | +1.4 |
| Sam Flanders | GC | C,F | 52 | 12 | 23.1 | 70.4 | 69.5 | +0.9 |
| Mitch Owens | SK | F | 39 | 3 | 7.7 | 66.4 | 65.9 | +0.5 |
| Jye Caldwell | ES | C,F | 64 | 9 | 14.1 | 72.1 | 71.8 | +0.3 |
| Ben Hobbs | ES | C,F | 42 | 2 | 4.8 | 66.6 | 66.4 | +0.2 |
View the Breakout Tracker data and chart for every player in the competition by becoming a member.
Sign up here.
For those who haven’t heard of the Breakout Tracker before, we calculate the career average for every player that has played under 100 games. We then work out the combined career average of the top AFL Fantasy players in the competition at the same time in their careers. We then compare those figures and give you a differential.
You can use this information to see how players compare to the best in the league. This will give you an idea of their breakout likelihood, or if they’re trending towards being one of the top AFL Fantasy performers in the competition.
To explain the data above, let’s take Jai Newcombe for example. Newcombe has played a total of 28 games for a career average of 81.1. The top 20 midfielders in the competition had a combined average of 72.7 after their first 28 games, giving him a +8.4 point differential. This indicates he is trending towards being one of the top AFL Fantasy performers in the competition.
Members of The Keeper League podcast receive data for every player in the competition separated by position. They also receive a chart that allows you to compare players and positions visually as demonstrated above.
This data will update after every round of the 2023 AFL season.